
Clutch tuning is all about INERTIA MANAGEMENT
Specifically, managing inertia flow out of the engine's rotating assy during launch and after the shifts. These inertia discharges are seldom discussed in detail, likely because in the past there has been no practical way to quantify them or their effects on the car. I wrote this article to change all that, to help racers comprehend what's really going on inside their bellhousing, and then to show how they might use that knowledge to make their car more efficient.
It's important to note that any time an engine is gaining rpm it's rotating assy absorbs some of its torque, which in-turn reduces its net torque output...
If you want to understand our numbers behind INERTIA MANAGEMENT, first you must get familiar with this simple formula-
...If the engine is operating WOT steady state, 100% of its torque production is available to be measured by a dyno's torque absorber.
...If an engine is accelerating at its maximum WOT no-load rate, it will have ZERO torque output, as the rotating assy itself is absorbing all the torque.
...If an engine is being pulled down against WOT, inertia discharge will increase torque output beyond the engine is capable of producing on its own.
Bottom line is the faster an engine's rotating assy gains rpm, the less net torque that engine will have left over to do actual work. The reduction of net engine torque might be relatively small in high gear where the acceleration rate might only be 350rpm/sec, but you will see a huge reduction of net engine torque at 3700+ rpm/sec 1st gear acceleration rates.
This formula allows one to visualize the EXPONENTIALLY increasing amount of inertia energy stored within an engine's rotating assy as it gains rpm. It's also a way to visualize the amount of inertia energy that is discharged as that same rotating assy loses rpm. Just basic physics that applies to the energy contained within most any common spinning flywheel. The formula does not assign a specific value to the energy, as that varies from engine to engine. But it does allow you to compare the relative amounts of energy flowing back and forth as an engine's rotating assy loses/gains rpm during launch/shifts. This formula is structured so that an assembly spinning at 1000rpm will contain 1 "unit" of energy. On the other end of the scale at 10,000rpm, that same rotating assy will contain 10 x 10 = 100 units of energy. Say you want to know how many units of energy are in a rotating assy spinning at some random rpm like say 6257?, just move the rpm number's decimal point 3 places to the left... 6.257 x 6.257 = 39.15 units of energy.
To quantify how much 1 unit of energy might represent, first lets remember that the entire assembly of pressure plate, flywheel, crankshaft, balancer, timing components, camshaft, pulleys, all those components bolted/meshed together become one big flywheel when in motion. Let's say it takes about 49 ft/lbs of torque applied for about 1 second to accelerate a rotating assy from 4500 to 5500, which means it also takes the same 49 ft/lbs of brake torque to slow that same rotating assy from 5500 to 4500rpm in one second. Since 4500rpm equals 20.25 units of energy using the formula above, and 5500rpm equals 30.25 units, the difference between the two is 10 units. If 10 units = 49ftlb/seconds, then 1 unit is equal to one tenth of that, or 4.9 ftlb applied over 1 second.
Is the 4.9ftlb/sec number correct for any engine? No, just ballpark for the 425ftlb engine in the following examples. If your rotating assy is heavier the number will likely be bigger, just the opposite for a lighter rotating assy.
49ft/lb/seconds might not seem like a lot, but when that 4500-5500 or 5500-4500 rpm 10 unit inertia exchange happens over a tighter time frame, the numbers start to get interesting. Acceleration/decceleration times and the torque required to accomplish them are inversely proportional. For example, 10 units of energy could be expressed as 49 ftlbs applied over 1.0 seconds, or 98ftlbs applied over 0.50 seconds, or 196ftlbs applied over 0.25 seconds.
NOTE- an engine's rotating assy itself can be used as an inertia dyno to create an engine specific ballpark ftlb/sec number. A steady state 5000rpm torque number and a 4500-5500 WOT no load sweep time is what I use.
RPM PULL DOWN DURING LAUNCH-...

In the graph above, note the engine was pulled down from 7174rpm (51.47 units) to 4622rpm (21.36 units) in 0.597sec by the clutch during launch. That's 30.11 units of energy discharged in 0.597sec. Since 1 unit in this example is equal to 4.9ftlb/sec, 30.11 units x 4.9ftlb/sec = 147.5ftlb/sec. The energy discharge occured in less than a second, so 147.5ftlb/sec / 0.597sec = 247ftlbs of inertia energy discharge. This torque is in addition to the engine's steady state torque production, which means 425ftlbs steady state torque + an added 247ftlbs due to inertia discharge = average 672ftlbs applied to the transmission's input shaft during the intial 0.597sec during launch. Multiplied by the transmission's 3.17 1st gear ratio, average torque to the driveshaft during launch is 2130ftlbs. (this engine's inertia discharge rate during launch on this pass was controlled by a ClutchTamer)
1st GEAR RPM RECOVERY-

In the graph above, note that after the clutch locks up, the engine accelerates from 4622rpm to 7629rpm in .859sec. The engine's rotating assy is now absorbing torque as it gets re-charged with rpm, 36.84 units x 4.9ftlb/sec per unit / .816sec = 221ftlb being re-charged into the rotating assy. 425ftlbs steady state - 221ftlbs absorbed by the rotating assy = 204ftlbs being applied to the transmission's input shaft. Multiplied by the transmission's 3.17 1st gear ratio, average torque to the driveshaft after launch in 1st gear is 647ftlbs.
1st to 2nd WOT CLUTCHLESS SHIFT FLARE-

In the graph above, note that after the transmission exited 1st gear @ 7629rpm, engine rpm flared to 7820 as the transmission crossed neutral. The rpm flare added 4.9ftlb/sec x 2.95 units = 14.46ftlb/sec of inertia energy to the engine's rotating assy over the 0.043sec while the transmission was crossing neutral. Power to the driveshaft was briefly interrupted, but the power being produced during that interruption was stored in the engine's rotating assembly, and then applied to the driveshaft after the shift.
RPM PULL-DOWN AFTER 1-2 SHIFT-
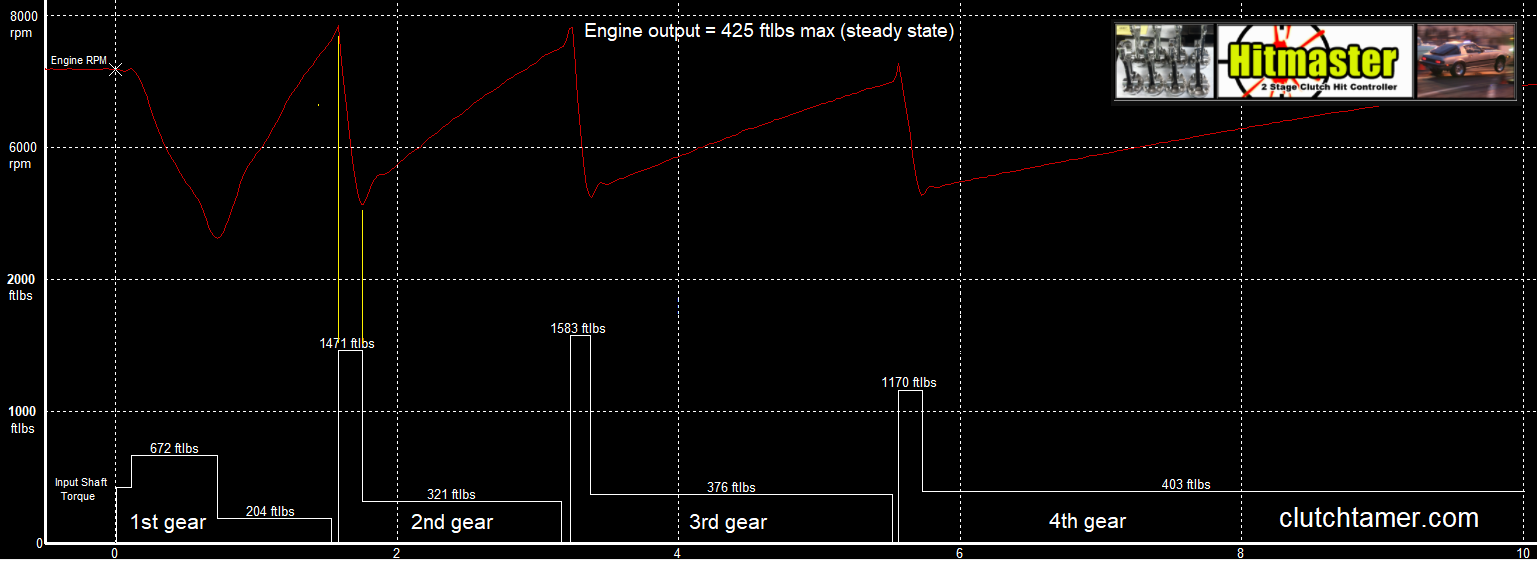
In the graph above, the engine was pulled down by the clutch from 7820rpm (61.15 units) to 5132rpm (26.33 units) in 0.163sec. That's 34.82 units of energy discharged in 0.163sec. Since 1 unit in this example is equal to 4.9ftlb/sec, 34.82 units x 4.9ftlb/sec = 170.6ftlb/sec. The energy discharge occured in less than a second, so 170.6ftlb/sec / 0.163sec = 1046.6ftlbs of inertia energy discharge. This torque is in addition to the engine's steady state torque production, which means 425ftlbs steady state torque + an added 1046.6ftlbs due to inertia discharge = average 1471.6ftlbs applied to the transmission's input shaft during the intial 0.163sec after the shift. Multiplied by the transmission's 1.96 2nd gear ratio, average torque to the driveshaft after the 1-2 shift is 2884.3ftlbs.
2nd GEAR RPM RECOVERY-

In the graph above, note that the engine pulls from 5132rpm to 7522rpm in 1.428sec (before the 2-3 shift flare as the trans crosses neutral). The engine's rotating assy is now absorbing torque as it gets re-charged with rpm, 30.21 units x 4.9ftlb/sec per unit / 1.428sec = 104ftlb being re-charged into the rotating assy. 425ftlbs steady state - 104ftlbs absorbed by the rotating assy = 321ftlbs being applied to the transmission's input shaft. Multiplied by the transmission's 1.96 2nd gear ratio, average torque to the driveshaft after pulldown in 2nd gear is 629.1ftlbs.
INPUT SHAFT TORQUE MULTIPLIED BY THE TRANSMISSION RATIOS-
I'm always amazed at how many guys don't want their clutch to slip after the shifts. An aggressive clutch can easily kill a transmission, just look at that 1471ftlb 2nd gear and 1583ftlb 3rd gear torque spikes on the graphs above. But that alone doesn't tell the whole story. Here's another graph from the same pass, but this time we multiplied torque at the input shaft by the transmission ratios...
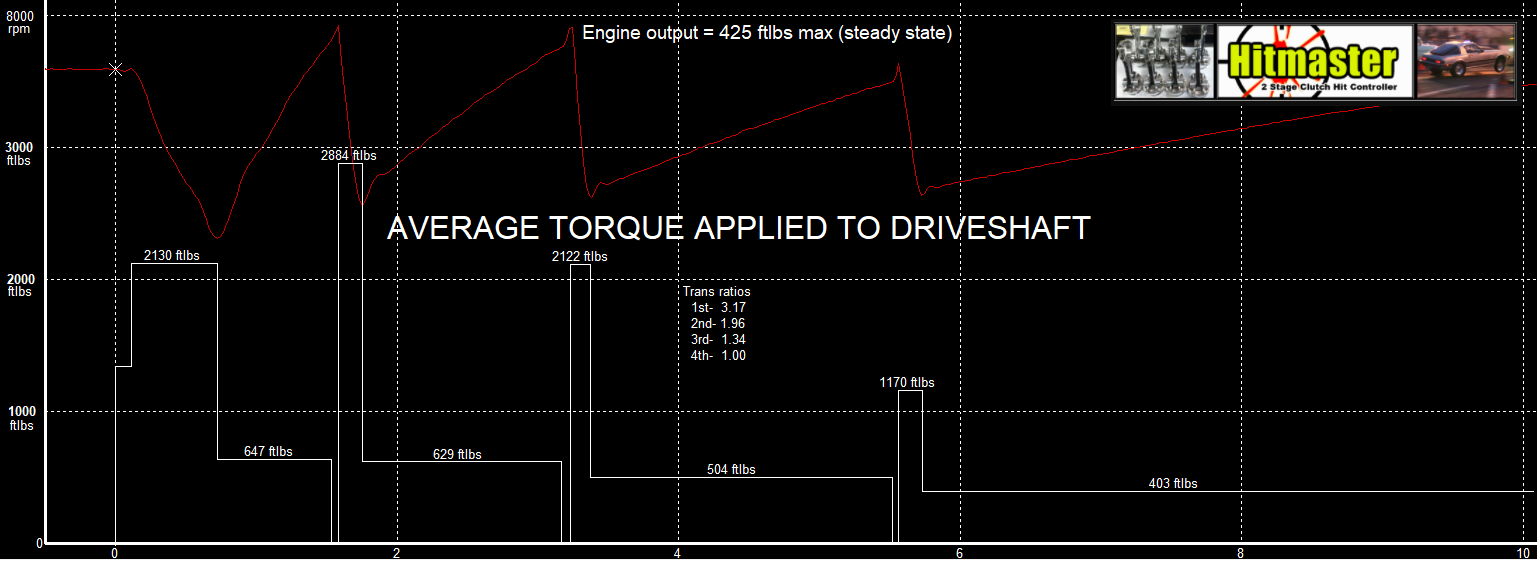
That spike after the shift into 2nd is the kind of thing that breaks u-joints and ring/pinion sets. This clutch needs it's base/static clamp pressure reduced, which would in-turn decrease the inertia draw rate after those "clutchless" shifts. Adjust/shim it enough to increase the 1/2 shift slip time from 0.163sec to around 0.220sec, torque applied to the driveshaft during 1/2 pull-down would decrease to roughly the same level as launch. If you shift using the clutch pedal, an alternative to shimming the pressure plate is to install a ClutchTamer which can add a little slip after the shifts.
Up to this point you might be skeptical of just how accurate these calculations might be, but notice how closely the above calculated average driveshaft torque numbers align with the pass's AccelG trace...
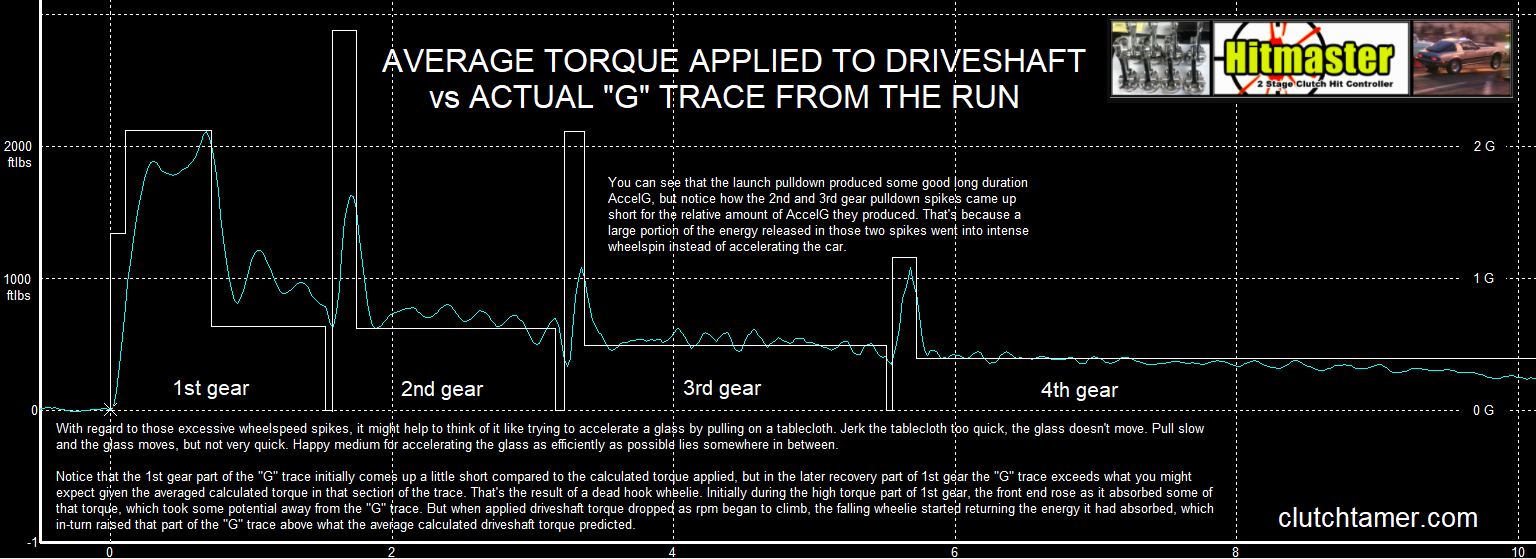
Here you can see that the launch pulldown produced some good long duration AccelG, but notice how the 2nd and 3rd gear pulldown spikes came up short for the relative amount of AccelG they produced. That's because a large portion of the energy released in those two spikes went into intense wheelspin instead of accelerating the car.
Might help to think of it like accelerating a glass by pulling on a tablecloth. Jerk the tablecloth too quick, the glass doesn't move. Pull slow and the glass moves, but not very quick. Happy medium for accelerating the glass as efficiently as possible lies somewhere in between.
You might also notice that the 1st gear part of the "G" trace initially comes up a little short compared to the calculated torque applied, but in the later recovery part of 1st gear the "G" trace exceeds what you might expect given the averaged calculated torque in that section of the trace. That's the result of a dead hook wheelie. Initially during the high torque part of 1st gear, the front end rose as it absorbed some of that torque, which took some potential away from the "G" trace. But when applied driveshaft torque dropped as rpm began to climb, the falling wheelie started returning the energy it had absorbed, which in-turn raised that part of the "G" trace above what the average calculated driveshaft torque predicted.
CHANGING THE GAME ON LAUNCHING YOUR STICK SHIFT CAR!!!